|
|
||||||||||||||||||||||||||
|
MetaDraw |
MetaDraw Customer Application |
![]() Software Solutions for Public Transport Services
Software Solutions for Public Transport Services
|
Subject: MetaDraw - Feedback Hello Jeff,
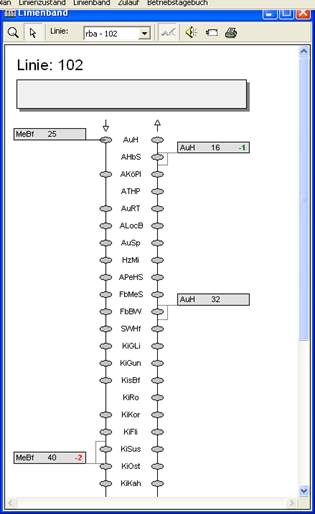
. . . First I'd like to introduce PSI Transcom ( www.psitrans.de) to you. We have a solution for public transport services. Our software monitors the the operating of their busses or trains, presents the situation on the various lines and routes to the dispatchers, alerts them in certain urgent cases, allows them to speak to the drivers and to take influence on the operational process, controls realtime passenger information and so on. See the attached flyer for a brief presentation. Most of the information is presented in form of data tables and grids to the user. But there are also some graphical presentations. For example a GIS presentation with exact geographic positioning of the vehicles on a map. And we also have some schematic presentations. For these schematic presentations we use MetaDraw. In most cases we have to draw a static background with a schematic view of stations and stops and above this background we draw and update (periodic or sponaneously) the vehicles at their current position relative to these stops and routes. An example is a line band view:
As time goes by the gray boxes representing vehicles move along the related route (downwards on left side and upwards on right side) and the dispatchers can easily recognize deviations between the current and the planned positions. Another example is a schematic route network:
Here the circles show color-coded the state of various components at each station. This is updated spontaneously as new information is reported from the related hardware. And then we also have a graphical presentation of the schedule, our so called Graphic Time Table.
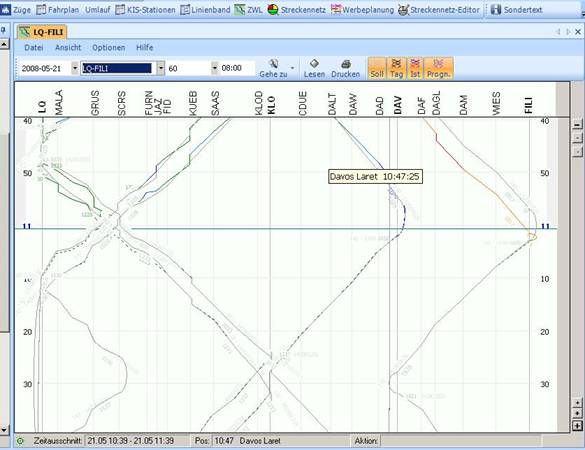
On a diagramm with the route as x-axis and the time as y-axis trips are shown with their scheduled and actual (or predicted) progress.
What makes MetaDraw so useful for us:
I hope this gives you a brief impression how we use MetaDraw.
With best regards, |

Copyright© Bennet-Tec Information Systems, Inc. All rights reserved.